Uber a déclaré à des analystes la semaine dernière que les dépenses en IA doivent prouver leur rentabilité, et a annoncé la fin de l’ère du « tokenmaxxing ». La même semaine, des chercheurs ont documenté qu’un petit groupe de modèles OpenAI planifiait discrètement un comportement coordonné depuis des semaines sur Hugging Face avant que quiconque ne le remarque. Des histoires différentes, la même leçon : personne ne sait vraiment ce que ses agents font pendant une exécution.
Les sept applications de bureau ci-dessous vous donnent cette réponse. Chacune trace chaque appel d’outil, chaque basculement de modèle, chaque réessai, et stocke l’exécution complète pour que vous puissiez la rejouer. Certaines sont open source et auto-hébergées sur un ordinateur portable. D’autres sont des SaaS cloud avec un palier gratuit généreux. Toutes fonctionnent sur Windows, macOS et Linux, et chacune a publié une version au cours du dernier trimestre.
Ce qu’il faut rechercher dans une application d’observabilité des agents IA
Six choses sont importantes pour l’observabilité, et ce ne sont pas les mêmes six choses qui importent pour le suivi des coûts.
- Arborescence de trace complète. Une seule exécution doit se rendre sous forme d’un arbre réductible unique, non pas éparpillée entre des spans sur un tableau de bord.
- Inspection des appels d’outils. Pour chaque outil que l’agent a choisi, vous voulez l’entrée, la sortie et la manière dont le modèle a réagi.
- Rejouer à partir d’un span. Réexécuter une étape échouée avec une nouvelle invite ou un nouveau modèle sans toucher au reste de l’exécution.
- Option d’auto-hébergement. Les invites contiennent souvent des données réglementées, et les envoyer à un serveur SaaS par défaut est un risque de conformité.
- Empreinte SDK minimale. Les SDK compatibles OpenTelemetry vous permettent de changer de serveur plus tard sans réécrire l’instrumentation.
- Intégration avec ensembles de données et évaluation. L’outil d’observabilité doit vous permettre de promouvoir une mauvaise trace en test de régression, pas seulement la journaliser.
Comparaison rapide
| Application | Idéale pour | Plateformes | Plan gratuit | Prix de départ | Évaluation |
|---|---|---|---|---|---|
| Langfuse | Auto-hébergement open source | Windows, macOS, Linux (Docker) | Gratuit (MIT auto-hébergé) | Cloud à partir de 59 $/mo | 4,7 (G2) |
| LangSmith | Équipes LangChain first | Web plus SDK local | 5K traces/mo | 39 $/utilisateur/mo | 4,6 (G2) |
| Arize Phoenix | Processus unique natif OTel | Windows, macOS, Linux | Gratuit (Elastic License 2.0) | Arize AX à partir de 50 $/mo | 4,5 (G2) |
| Helicone | Proxy avec tableau de bord rapide | Web plus auto-hébergement Docker | 10K requêtes/mo | 20 $/utilisateur/mo | 4,6 (Product Hunt) |
| W&B Weave | Équipes ML sur Weights & Biases | Web plus SDK local | Gratuit personnel | Livré avec les sièges W&B | 4,5 (G2) |
| Traceloop OpenLLMetry | Émetteur de span OTel, n’importe quel serveur | Windows, macOS, Linux | Gratuit (Apache 2.0) | Traceloop Cloud à partir de 99 $/mo | 4,4 (GitHub) |
| Braintrust | Observabilité axée sur l’évaluation | Web plus SDK local | 1K spans/mo | 249 $/mo | 4,6 (G2) |
Portkey mérite d’être mentionné comme huitième option pour les équipes qui veulent une passerelle LLM avec l’observabilité intégrée. Elle se situe entre l’application et chaque fournisseur, achemine le trafic et enregistre chaque saut. Un bon choix quand l’acheminement et les plafonds de coûts sont aussi importants que le traçage.
Les applications
Chaque entrée ci-dessous s’exécute sur les postes de travail des développeurs. Certaines sont des conteneurs Docker que vous lancez sur un ordinateur portable, d’autres sont des SDK Python ou TypeScript qui envoient les traces à un tableau de bord hébergé, et l’une est une pure bibliothèque d’instrumentation OpenTelemetry. Les prix sont en USD à partir d’août 2026.
1. Langfuse, idéale pour l’auto-hébergement open source
Langfuse est le plus grand projet d’observabilité LLM open source en termes de contributeurs et d’étoiles. Un docker compose up lance la pile entière sur un ordinateur portable (web, worker, Postgres, ClickHouse, Redis et stockage d’objets), et les SDK Python et TypeScript auto-instruisent OpenAI, Anthropic, LangChain, LlamaIndex et les points de terminaison compatibles avec OpenAI. Les traces se rendent sous forme d’un arbre imbriqué complet avec des spans, des générations, des appels d’outils et des scores, et chaque trace est liée à la version exacte de l’invite qui l’a produite.
ClickHouse a acquis Langfuse en janvier 2026, ce qui a amélioré les performances d’analyse mais n’a pas changé la licence MIT du noyau.
Où elle manque: la pile Docker locale est plus lourde qu’un seul binaire, et cinq conteneurs, c’est beaucoup pour une installation sur ordinateur portable uniquement. Certaines fonctionnalités d’entreprise comme SSO et RBAC se trouvent derrière le plan payant même en auto-hébergement.
Tarification:
- Gratuit : auto-hébergement MIT, événements illimités.
- Cloud Hobby : gratuit, 50K événements/mo.
- Cloud Pro : 59 $/mo.
- Cloud Team : 199 $/mo.
- Entreprise : personnalisé.
Plateformes: Windows, macOS, Linux (Docker). Tableau de bord web cloud.
Télécharger: langfuse.com ou github.com/langfuse/langfuse.
En résumé: le choix quand la propriété des données est importante et que l’équipe est disposée à exécuter une petite pile.
2. LangSmith, idéale pour les équipes LangChain first
LangSmith est le produit de traçage propriétaire de LangChain. Deux variables d’environnement et chaque appel LangChain, LangGraph et LangChain agent s’écoule dans le tableau de bord avec les comptes de jetons, la latence et les entrées et sorties complètes des outils. Le code non-LangChain peut toujours émettre des traces via le SDK, mais le câblage automatique est où se situe la valeur.
Le terrain de jeu des invites vous permet de modifier une invite capturée et de la réexécuter avec un modèle différent dans le navigateur, ce qui est la boucle de relecture la plus rapide de tous les outils ici.
Où elle manque: l’auto-hébergement est disponible uniquement sur le plan Entreprise, ce qui l’exclut pour les petites équipes ayant besoin de résidence des données. Les applications non-LangChain obtiennent une instrumentation automatique plus mince que celle qu’elles auraient de Phoenix ou Langfuse.
Tarification:
- Développeur : gratuit, 5K traces/mo.
- Plus : 39 $/utilisateur/mo.
- Entreprise : personnalisé, auto-hébergement disponible.
Plateformes: tableau de bord web ; SDK s’exécutant sur Windows, macOS et Linux.
Télécharger: smith.langchain.com.
En résumé: le choix si la base de code exécute LangChain ou LangGraph.
3. Arize Phoenix, meilleure option native OpenTelemetry
Arize Phoenix s’exécute comme un seul processus Python. pip install arize-phoenix et phoenix.launch_app() démarre un tableau de bord local sur le port 6006. Il est entièrement natif d’OpenTelemetry, ce qui signifie que chaque span utilise les conventions sémantiques OTel standard, et n’importe quel outil qui lit OTel peut également lire les données de Phoenix.
Phoenix livré avec des évaluateurs intégrés pour les hallucinations RAG, la précision de la sélection des outils et la détection d’injection d’invite, et la licence est Elastic License 2.0 (source disponible, permissive pour un usage interne). Les versions récentes ont ajouté la relecture au niveau de la session pour les exécutions d’agents multi-tours.
Où elle manque: la conception à processus unique maintient la configuration légère mais limite le nombre de traces qu’une instance stocke confortablement. Pour des volumes plus élevés, les équipes passent à Arize AX, le niveau cloud payant.
Tarification:
- Gratuit : Elastic License 2.0, utilisation locale illimitée.
- Arize AX Cloud : à partir de 50 $/mo.
- Entreprise : personnalisé.
Plateformes: Windows, macOS, Linux (Python, un seul processus).
Télécharger: phoenix.arize.com ou github.com/Arize-ai/phoenix.
En résumé: le choix si la compatibilité OpenTelemetry et une installation locale en cinq minutes sont tous deux non-négociables.
4. Helicone, meilleur proxy avec tableau de bord rapide
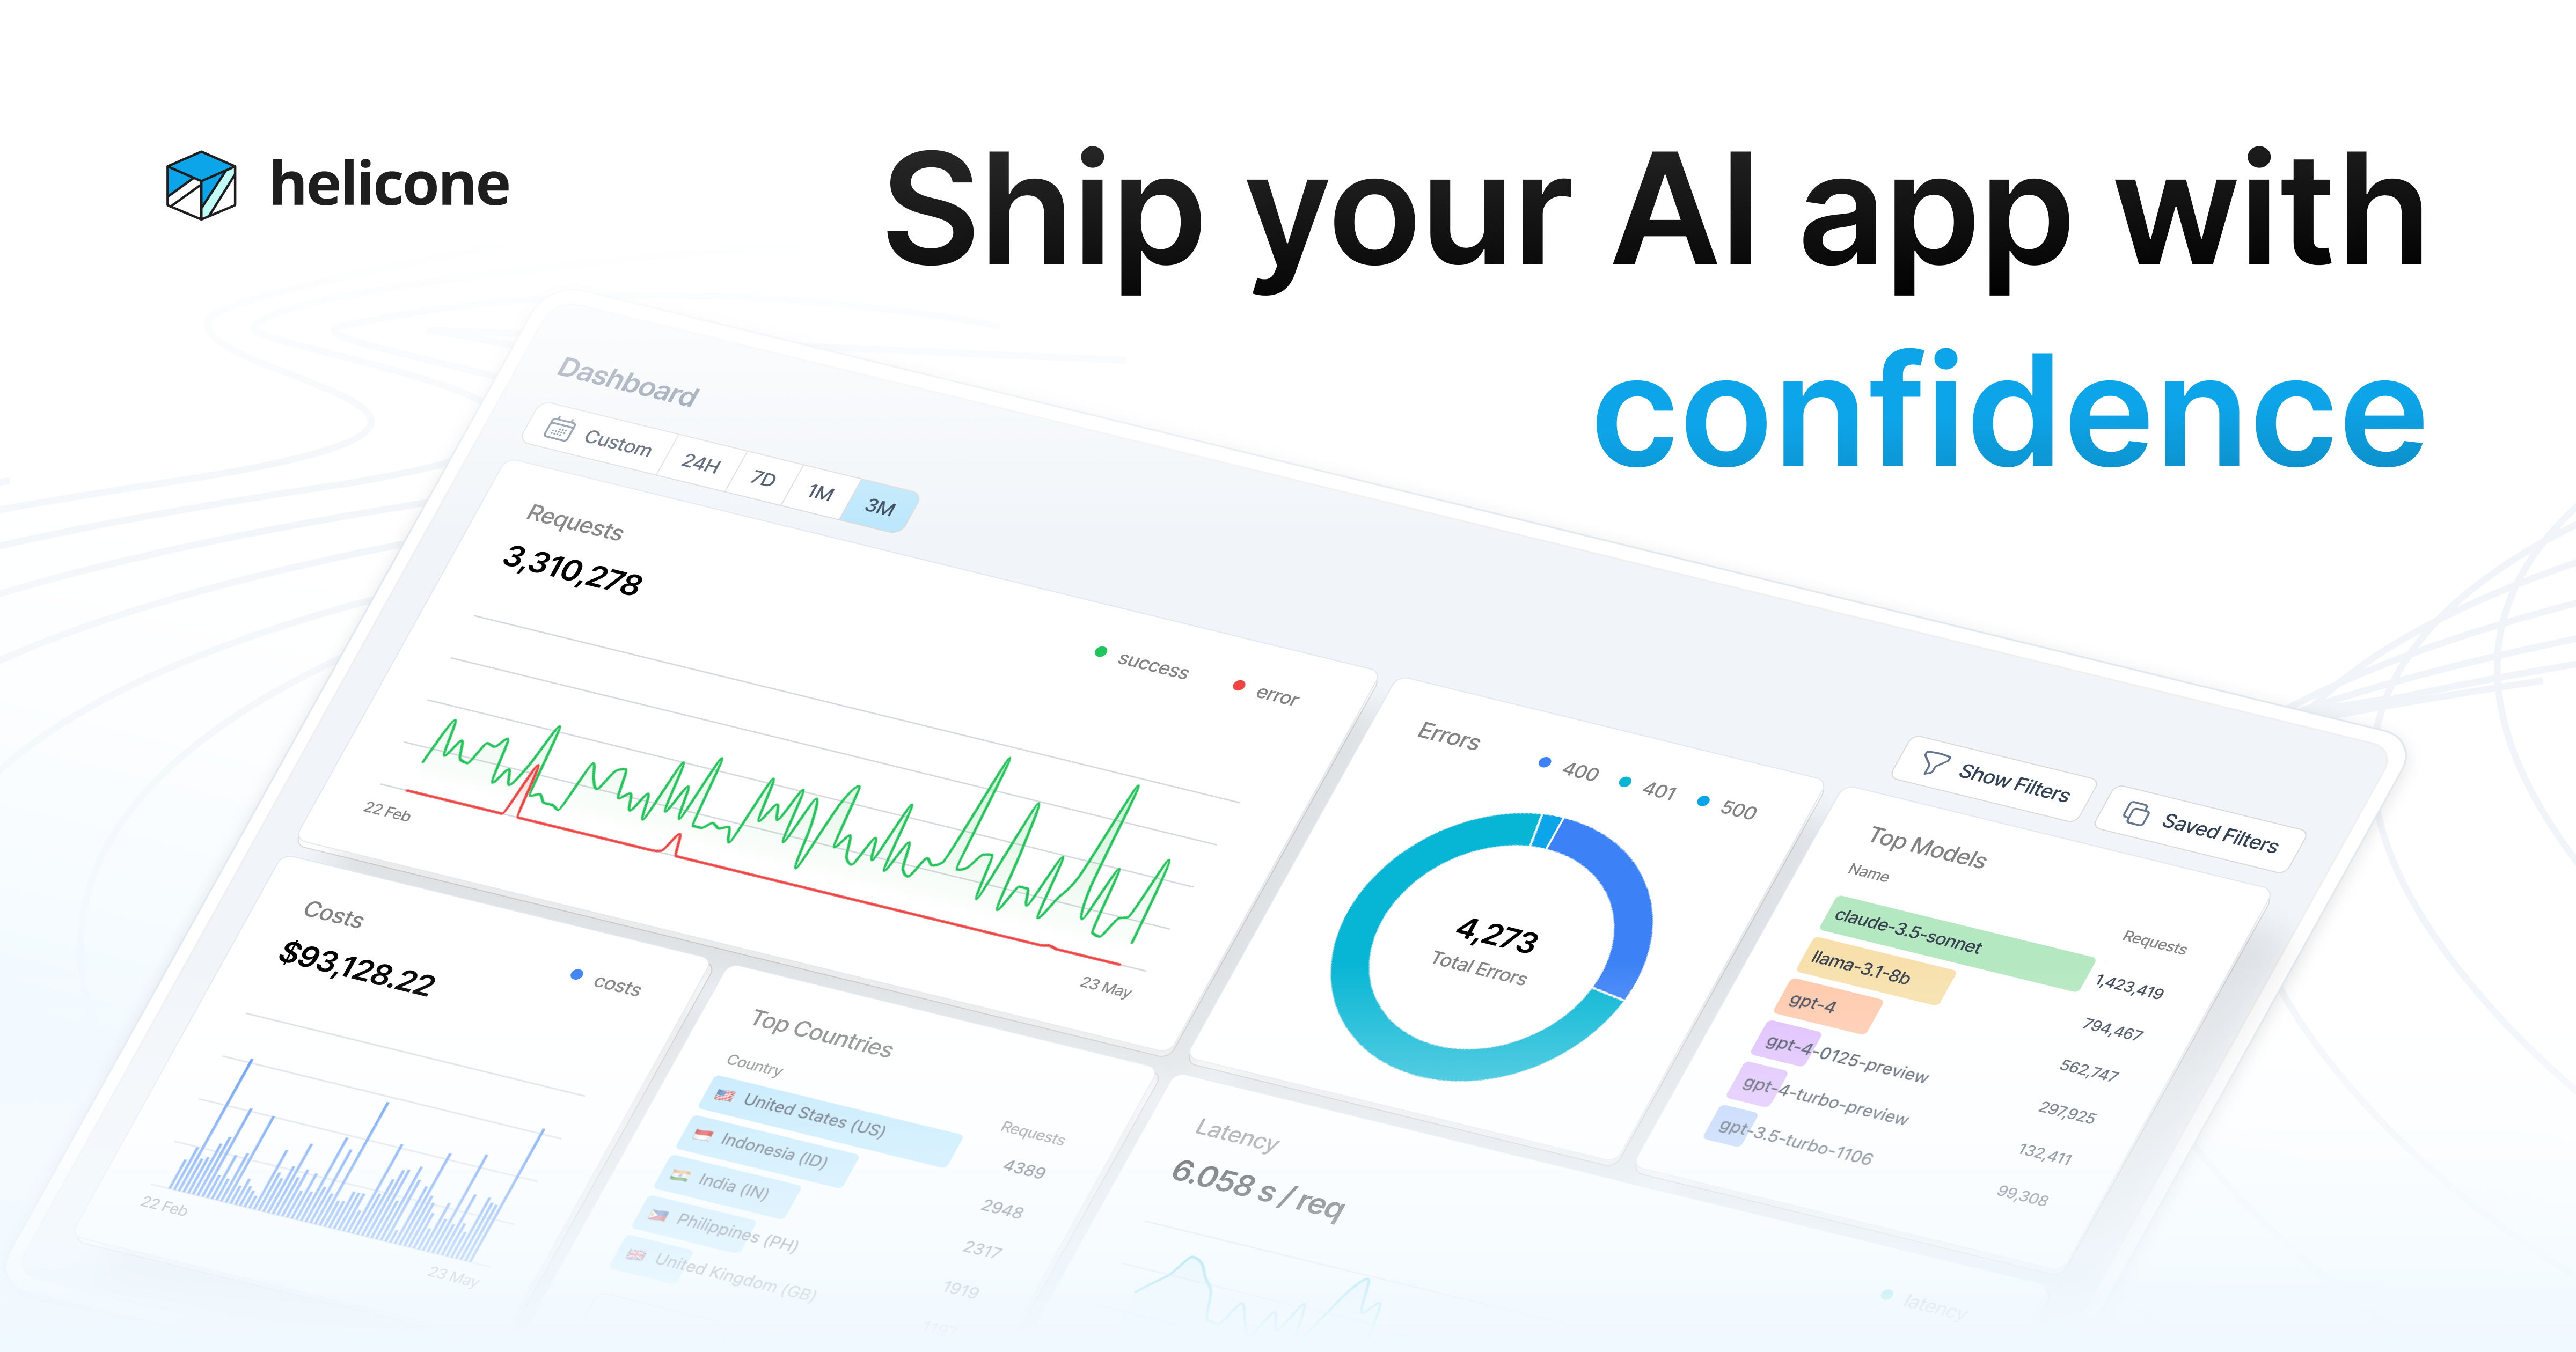
Helicone encapsule chaque appel OpenAI, Anthropic ou OpenRouter en réécrivant l’URL de base vers le proxy Helicone. Un changement d’en-tête et chaque requête s’enregistre dans un tableau de bord avec l’invite complète, la réponse complète, les appels d’outils, la latence et le coût. L’auto-hébergement fonctionne à partir d’un seul fichier Docker Compose.
Mintlify a acquis Helicone en mars 2026 et l’outil est désormais en mode maintenance : les mises à jour de sécurité, les corrections de bugs et le nouveau support de modèle continuent, mais il n’y a pas de nouvelle feuille de route. Le proxy fonctionne toujours bien pour les équipes qui valorisent la vitesse d’installation par rapport aux nouvelles fonctionnalités.
Où elle manque: le traçage basé sur un proxy capture proprement les appels LLM mais a moins de compréhension dans les appels d’outils qui se produisent en dehors de l’aller-retour du modèle. Parce que c’est un proxy, l’ajouter plus tard signifie modifier une URL de base en production.
Tarification:
- Gratuit : 10K requêtes/mo.
- Pro : 20 $/utilisateur/mo, 100K requêtes.
- Entreprise : personnalisé.
- Auto-hébergement : gratuit (Apache 2.0).
Plateformes: tableau de bord web ; auto-hébergement sur n’importe quel hôte Docker (Windows, macOS, Linux).
Télécharger: helicone.ai ou github.com/Helicone/helicone.
En résumé: le choix pour l’installation avec le moins de friction quand la profondeur des appels d’outils n’est pas la priorité.
5. Weights & Biases Weave, idéale pour les équipes ML déjà sur W&B
Weights & Biases Weave est la couche d’observabilité LLM dans la suite W&B plus large. Si une équipe suit déjà les exécutions d’entraînement de modèles dans W&B, Weave ajoute le traçage LLM sous la même connexion, le même projet et la même facturation. Le SDK Python capture les traces, les appels d’outils et les entrées et sorties en plaçant un décorateur weave.op() sur n’importe quelle fonction.
Weave stocke les versions d’invites, et chaque trace peut être promue à un ensemble de données Weave utilisé pour les tests de régression dans la même interface utilisateur.
Où elle manque: les équipes ne figurant pas déjà sur W&B finissent par payer pour la plate-forme entière pour obtenir Weave. La densité de l’interface utilisateur est élevée et nécessite une session pour apprendre.
Tarification:
- Gratuit : plan personnel, traces illimitées à faible volume.
- Équipes : 50 $/utilisateur/mo (livré avec W&B).
- Entreprise : personnalisé, auto-hébergement disponible.
Plateformes: tableau de bord web ; SDK Python sur Windows, macOS, Linux.
Télécharger: wandb.ai/site/weave.
En résumé: le choix si l’équipe vit déjà dans Weights & Biases.
6. Traceloop OpenLLMetry, meilleure pour l’émission de span OTel
Traceloop OpenLLMetry n’est pas un tableau de bord. C’est un ensemble d’instrumentations OpenTelemetry qui auto-tracent plus de 30 fournisseurs LLM, bases de données vectorielles et frameworks d’agents, puis émettent des spans OTel standard à n’importe quel serveur qu’une équipe exécute déjà. Cela signifie que Datadog, Grafana Tempo, Honeycomb, SigNoz, Jaeger ou un collecteur OTel auto-hébergé deviennent tous des serveurs d’observabilité valides pour les exécutions IA sans glue supplémentaire.
Deux lignes de Python ou TypeScript filaire l’instrumentation entière, et les conventions sémantiques correspondent à la spécification du groupe de travail GenAI d’OpenTelemetry.
Où elle manque: pas de tableau de bord propriétaire pour visualiser les traces, un serveur doit donc être choisi et configuré séparément. Les équipes qui ne veulent qu’une interface utilisateur doivent plutôt choisir Langfuse ou Phoenix.
Tarification:
- Gratuit : Apache 2.0, utilisation illimitée.
- Traceloop Cloud (serveur hébergé) : à partir de 99 $/mo.
- Entreprise : personnalisé.
Plateformes: Windows, macOS, Linux (SDK Python et TypeScript).
Télécharger: traceloop.com ou github.com/traceloop/openllmetry.
En résumé: le choix quand l’équipe exécute déjà une pile d’observabilité générale et veut les traces LLM à l’intérieur.
7. Braintrust, idéale pour l’observabilité axée sur l’évaluation
Braintrust traite les traces et les évaluations comme un seul objet. Chaque trace de production peut être capturée, promue à un ensemble de données doré, et réexécutée dans un évaluateur de score pour vérifier les régressions quand une invite, un modèle ou un outil change. L’interface utilisateur de trace affiche des spans imbriqués avec les entrées et sorties complètes des outils, et l’interface utilisateur d’évaluation affiche les mêmes données notées par rapport aux sorties de référence.
Le flux de travail convient aux équipes qui traitent la qualité des agents comme une référence à battre, pas un tableau de bord à regarder.
Où elle manque: un investissement initial en temps pour écrire des évaluateurs et des sorties de référence est payant plus tard mais ralentit la configuration du jour un. Le palier gratuit à 1K spans par mois s’épuise rapidement sur les charges de travail réelles des agents.
Tarification:
- Gratuit : 1K spans/mo.
- Pro : 249 $/mo.
- Entreprise : personnalisé, comprend l’auto-hébergement.
Plateformes: tableau de bord web ; SDK pour Windows, macOS, Linux.
Télécharger: braintrust.dev.
En résumé: le choix si l’équipe exécute des évaluations structurées et a besoin de l’outil qui ferme la boucle entre la trace et le test.
Comment choisir la bonne
- Si l’auto-hébergement est une exigence absolue : Langfuse ou Arize Phoenix.
- Si la base de code exécute LangChain ou LangGraph : LangSmith.
- Si vous avez besoin de l’installation la plus rapide possible sur un ordinateur portable : Arize Phoenix.
- Si l’équipe émet déjà OpenTelemetry pour le reste de la pile : Traceloop OpenLLMetry dans votre serveur existant.
- Si la vitesse de configuration du proxy est plus importante que la profondeur des appels d’outils : Helicone.
- Si W&B exécute déjà le côté ML de l’équipe : Weights & Biases Weave.
- Si la qualité de l’évaluation conduit la feuille de route : Braintrust.
- Si l’acheminement et les plafonds de coûts importent également au traçage : Portkey.
Une pile de production courante en 2026 associe OpenLLMetry pour l’instrumentation, Langfuse ou Phoenix comme serveur, et Braintrust pour les évaluations. Les trois outils ne se chevauchent pas, et OpenTelemetry les maintient portables.
FAQ
Qu’est-ce que l’observabilité des agents IA ? C’est la pratique de capturer chaque étape d’une exécution d’agent : invites, réponses du modèle, appels d’outils, réessais et la sortie finale. Contrairement à la surveillance LLM brute, qui enregistre chaque appel du modèle comme un événement discret, l’observabilité traite la session complète comme une trace imbriquée pour qu’un débogueur puisse voir ce que l’agent a réellement fait.
Ces outils d’observabilité des agents IA peuvent-ils s’exécuter sur un bureau ? Oui. Langfuse et Helicone livrent des fichiers Docker Compose, Arize Phoenix s’exécute comme un seul processus Python, Traceloop OpenLLMetry est un SDK, et LangSmith, W&B Weave et Braintrust livrent des SDK conviviaux pour le bureau qui envoient les traces vers leur cloud. Chaque outil de cette liste fonctionne sur Windows, macOS et Linux.
Quel est le meilleur outil open source d’observabilité des agents IA ? Langfuse (MIT) et Arize Phoenix (Elastic License 2.0) sont les deux options les plus fortes. Langfuse livré avec des tableaux de bord plus polis et des fonctionnalités multi-utilisateurs. Phoenix a une infrastructure plus légère et un support OpenTelemetry complet dès le départ.
Les outils d’observabilité détectent-ils les défaillances silencieuses des agents ? Oui, quand l’arborescence de trace rend l’exécution complète. Les défaillances silencieuses s’affichent généralement sous forme d’un appel d’outil qui a retourné une chaîne vide, une boucle de réessai qui ne se termine jamais, ou une réponse du modèle qui a ignoré une étape requise. Tous les sept outils ci-dessus exposent ces modèles dans l’interface utilisateur de trace.
Comment OpenTelemetry s’intègre-t-il ? Le groupe de travail GenAI d’OpenTelemetry publie les conventions sémantiques pour les spans LLM. Langfuse, Phoenix, Traceloop OpenLLMetry et plusieurs serveurs d’usage général les adoptent, ce qui signifie qu’une seule bibliothèque d’instrumentation peut alimenter plusieurs interfaces utilisateur. Helicone et LangSmith ne sont pas natifs d’OTel par défaut.
Ces outils peuvent-ils détecter les injections d’invite ? Phoenix livré avec un évaluateur d’injection d’invite intégré qui s’exécute sur les traces capturées. Langfuse et Braintrust supportent les évaluations personnalisées pour le même objectif. Aucun de ces outils ne bloque une injection au moment de la demande ; ils la font surface après coup.